Wellers Bay Testing
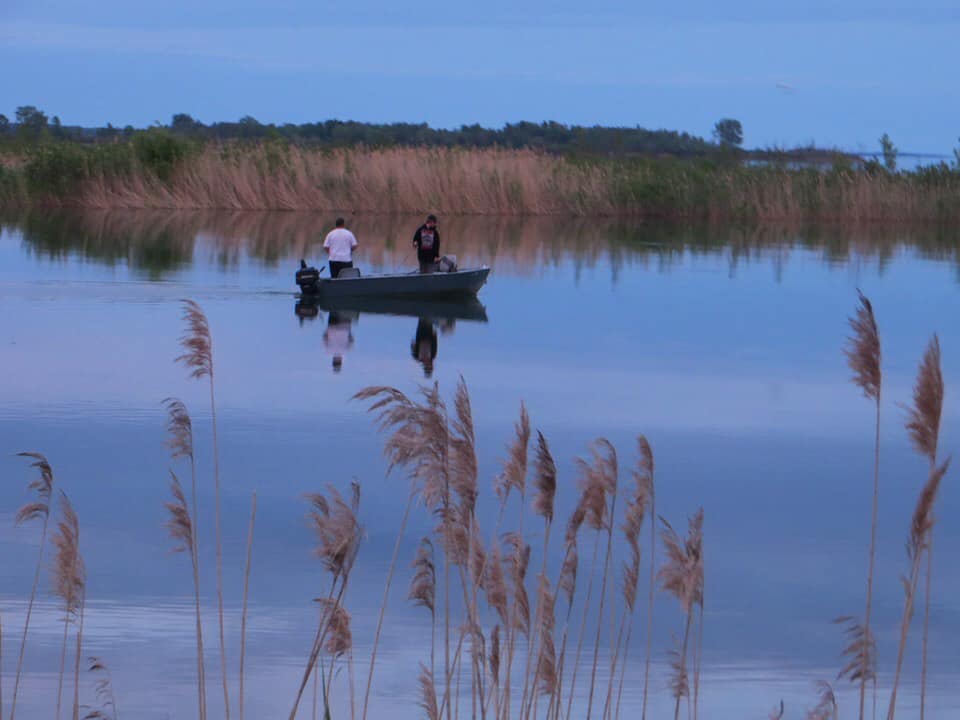
Since 2010, Karen Mouck, as a volunteer with the Ontario Lake Partner Program, has been collecting samples of water from Wellers Bay (year over year data is available here).
A strict protocol is followed. Every month from May through to October, for a total of six collections per year, water is collected in a bottle, then filtered through a fine synthetic mesh, and then poured into two test tubes and a plastic specimen jar. The samples are packed and mailed next day delivery to the lab in Dorset for analysis.
In addition, the clarity of the water is measured using a secchi disk.
As we know the bottom of Wellers Bay is often covered in silt and weeds, and clarity can be affected by wave and wind action. The range of clarity has varied from a yearly average of 2.6 metres to 3.9 metres, that is, how far you can see the secchi disk in the water before it disappears. These variations are probably related to how windy it was for the few days around the time of the sampling, causing the silt to be stirred up into the water and thus adversely affecting clarity.
More importantly, the levels of phosphorus are measured at the lab.
Total Phosphorus TP concentrations are ideally used to interpret lake nutrient status since phosphorus is the element that controls the growth of algae in most Ontario lakes. Increases in phosphorus may decrease water clarity by stimulating algal growth. In extreme cases, algal blooms will affect the aesthetics of the lake and/or cause taste and odour problems in the water.
Under normal water flows, roughly two thirds of the total phosphorus load to lakes and rivers comes from sources such as runoff from pasture and croplands, atmospheric deposition and stream bank erosion. Some other commons sources of runoff leading to phosphorus loading are golf courses, private and public lawns and gardens where fertilizer is uses, and seepage from individual septic systems.
Lakes with less than 10 µg/L TP are considered oligotrophic. These lakes rarely experience nuisance algal blooms. Lakes with TP between 10 and 20 µg/L are termed mesotrophic and are in the middle with respect to trophic status. These lakes show a broad range of characteristics and can be clear at the bottom end of the scale or susceptible to moderate algal blooms at concentrations near 20 µg/L. Lakes over 20 µg/L are classified as eutrophic and may exhibit persistent, nuisance algal blooms.
You will be pleased to know that the water in Wellers Bay is of excellent quality in the analysis of total phosphorus.
The average TP in Wellers Bay for the nine years – or for a total of 54 water samples is 12.6 ug/l, and in 2018, it was 11.4 ug/l. These readings have been quite stable for nine years. Generally, in the months of May and October, the levels are at their lowest.
Overall, the water in Wellers Bay is at the low end of mesotrophic and therefore we are unlikely to see algae blooms.
Water clarity can also be altered by invading species such as zebra mussels. While it is always best, therefore, to use TP to evaluate the nutrient status of the lake, water clarity readings are valuable to track changes in the lake that might be occurring that would not be noticed by monitoring TP concentrations alone, e.g. zebra mussel invasions or watershed disturbances.
In some lakes, particularly in the shield regions, the level of calcium in the water has been decreasing. Some scientists are blaming acid rain and the impact of logging. For several years, Wellers Bay water was measured. One of the aquatic species adversely affected by low levels of calcium is the native crayfish. As this bay is situated on limestone, the level of calcium in the water was very high.
The Lake Partner Program does not measure bacteria levels such as e coli. E. coli comes from human and animal waste. During rainfalls, snow melts, or other types of precipitation, E. coli may be washed into creeks, rivers, streams, lakes, or groundwater. When these waters are used as sources of drinking water and the water is not treated or inadequately treated, E. coli may end up in the drinking water. For more information, or to obtain a water sampling kit, contact your local public health unit.